
How to Detect Engineering Drift Before Thresholds Fire
Detect AI-driven engineering drift by tracking the slope of human ownership, review depth and rework per service, then acting before thresholds fire.

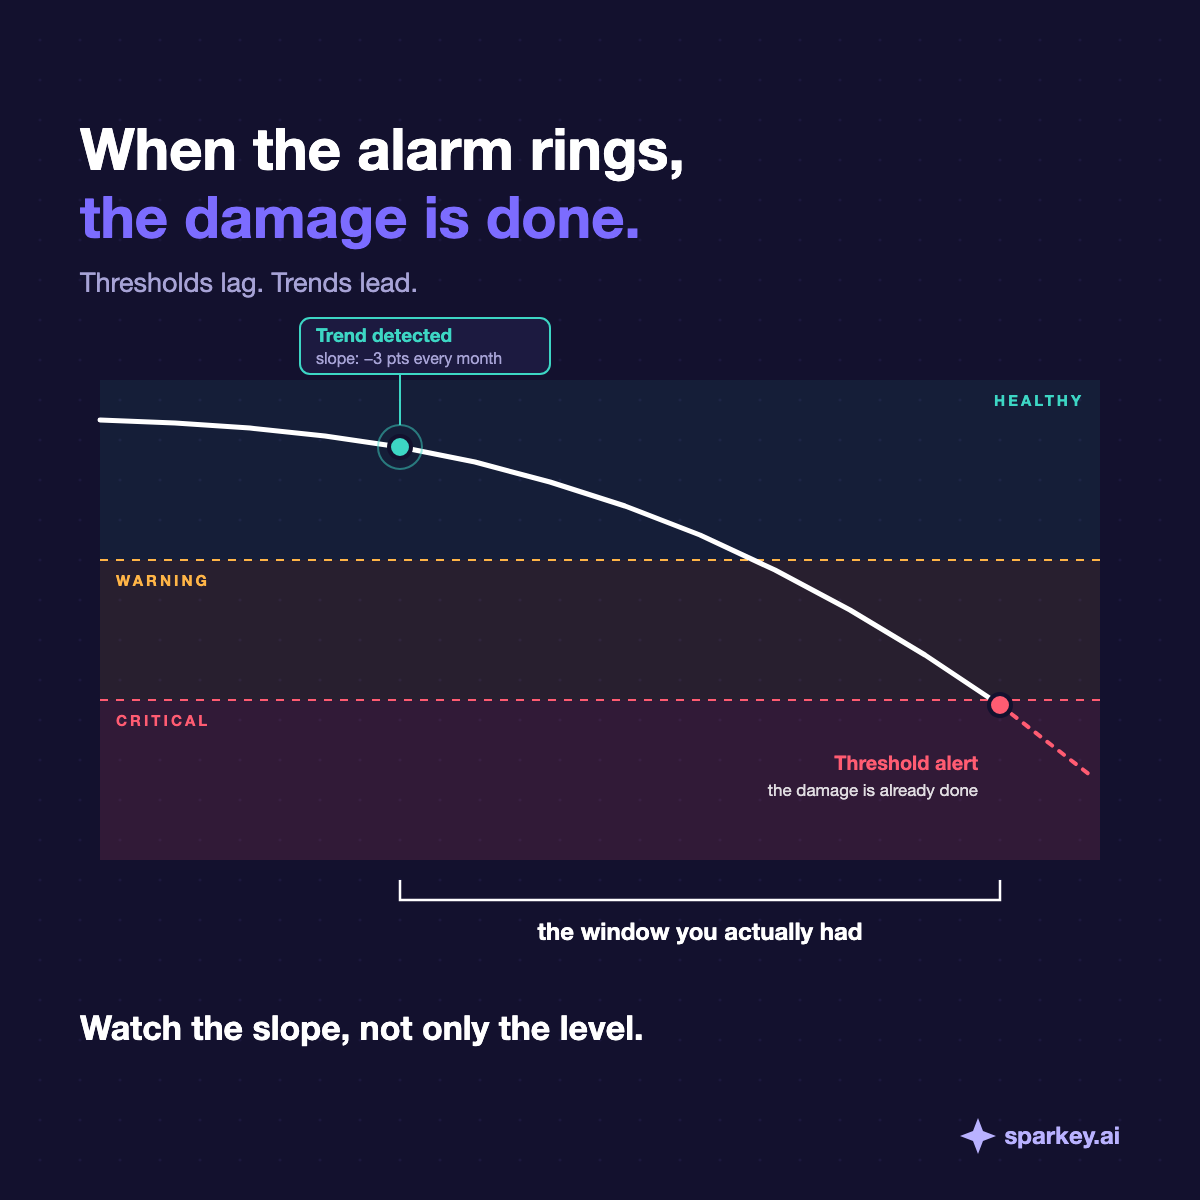
You detect AI-driven engineering drift by tracking the direction and speed of a few signals per service (human-touched share, review depth, ownership concentration, churn and reverts) and projecting them forward, instead of waiting for a fixed threshold to break. A steady decline is visible months before a breach, and that lead time is what lets you act cheaply. Thresholds still have a role, but as the last line of defense, not the first.
This is part 3 of 5 in our series on the AI SDLC. It assumes you can already tell how much of your merged code a human wrote, edited or directed, and asks what to do with those numbers over time.
What is engineering drift?
Drift existed long before coding agents. Teams have always let services rot quietly after a reorg or a key engineer leaving. What AI changes is the speed and the mood. The volume of change goes up, the cost of producing a plausible pull request goes down, and the signals that used to warn you (a frustrated reviewer, a slow sprint) get smoothed away.
Why do threshold alerts fire after the damage?
Most engineering dashboards alert on a line: test coverage under 70%, change-failure rate over 15%, human-touched code under 30%. These lines are reasonable. The problem is what a breach means. When it fires, the underlying cause has usually been in motion for two or three quarters.
Take our running example, a ledger service. Suppose it was 61% human-touched in March. Every month a few more agent-generated changes merge with light edits. By the time it crosses 30%, the two engineers who understood the double-entry logic have moved to other teams, the multi-currency change for checkout was written mostly by an agent and reviewed in ten minutes, and nobody can confidently say which invariants the code still enforces. The alert is accurate. It is also a notice that you are now running a recovery project.
Thresholds share three structural weaknesses:
- They are binary. A service at 31% and falling fast looks identical to a service at 31% and stable: both are green.
- They lag the cause. Outcome metrics like change-failure rate move only after the code that will fail is already in production.
- They are set once and forgotten. A line chosen two years ago for a pre-AI team rarely fits a team where agents now produce half the diff volume.
Why AI-driven drift is gradual and feels good
The uncomfortable part is that drift caused by AI adoption usually coincides with metrics that look great. Throughput is up. Cycle time is down. Engineers report that they are faster. Each of those statements can be true while ownership erodes underneath.
Three mechanisms drive it. First, review gets lighter: agent pull requests are well formatted, have tests and descriptions, and "look fine," so reviewers spend less time per changed line. Second, understanding stops accumulating: when an engineer directs an agent instead of writing the code, they learn less about the service unless they deliberately read and edit the result. Third, local fixes win over structural ones: an agent will happily add a fourth currency-conversion helper rather than notice there are already three. None of these triggers an alarm on its own.
No single week is alarming. A year later a core service is 22% human-touched and nobody can change it safely.
Slope vs. level: how do you spot drift early?
The level tells you where a service is. The slope tells you where it is going and how fast. For drift, the slope is the earlier and more actionable signal.
A steady 3-point monthly decline in human-touched share is a clear example. Starting from 61%, that is still above 50% after three months, which no threshold would flag. But at that rate the service crosses 30% in about ten months. If you see the slope in month two, you have eight months to respond with small moves. If you wait for the threshold, you have none.
Practical ways to read slope without overreacting:
- Use a rolling window (for example, a 90-day trailing value computed weekly) so one large refactor or one vacation week does not dominate.
- Fit a simple linear trend over the last three to six months and report the monthly change, not just the latest value.
- Flag sustained slopes (the same direction for several consecutive periods), not single drops.
- Compare the slope to the service's own history first and to peers second; some services are legitimately more automated than others.
How do you find which services carry the risk?
An org-wide average is almost always misleading. A company can sit at a comfortable 55% human-touched overall while two services are at 25% and falling, because many small, stable repositories pull the average up. The average stays flat; the risk concentrates.
Break every drift signal down by service, then team, then area of the codebase, and rank by a combination of slope and criticality. A fast decline in an internal admin tool matters less than a slow decline in the ledger. The output you want is a short list: the handful of places where the trend is negative, the service is important, and ownership is already thin.
Which signals should you watch for AI-era drift?
You do not need dozens of metrics. These six, tracked per service with trends, cover most of the ways drift shows up:
- Human-touched share: the portion of merged code a person wrote, meaningfully edited or directed. The core ownership signal.
- Review depth: review time and comments per changed line, not per pull request. Larger agent diffs reviewed in the same time mean shallower review.
- Ownership concentration (bus factor): how many people have made meaningful human changes to the service recently. One or two names is fragile.
- Duplication: new near-copies of existing logic, an early sign that boundaries are eroding.
- Churn and rework: code rewritten or deleted within a few weeks of merging.
- Revert and change-failure rate: the outcome signals, measured over all pull requests, not only AI-assisted ones.
The first four are leading signals; the last two are lagging. You want both, because leading signals tell you early and lagging signals tell you whether the early warning was right.
How do you forecast drift honestly?
"At this rate we hit critical in Q2" is a sentence a leadership team can act on. It turns a chart into a deadline. But a projection can also mislead, so keep it honest:
- Show a range, not a date. Project with an uncertainty band and say "between April and July" rather than "April 14."
- Require minimum data. Do not project from fewer than three months of history or from a service with too few merged changes to be stable.
- Account for seasonality. Holidays, release freezes, hiring waves and reorgs bend every engineering metric. Mark them on the chart and exclude or adjust for them before fitting a trend.
- Prefer simple models. A linear trend with a band is easy to explain and hard to over-trust. If a projection needs a paragraph to justify, it will not drive a decision.
- Re-project often. A projection is a hypothesis; update it monthly and say when it changed.
How do you tie drift to outcomes?
A falling human-touched share is not automatically bad. Some code should be mostly generated: boilerplate, migrations, test scaffolding. The question is whether the drift is costing you something. To answer it, look for outcomes in the same areas where the leading signals moved.
For the ledger service, that means asking: are reverts rising in the files where human-touched share fell? Are incidents tracing back to changes with short reviews? Is rework concentrated in the multi-currency paths the agent wrote? When leading and lagging signals move together in the same place, you have a real problem with evidence. When ownership drops but reverts, incidents and rework stay flat, you may simply have a well-automated service, and that is worth knowing too.
Turning a detection into a decision
Detection only matters if it buys you time and you spend that time. Every drift finding should end in a concrete decision with a name attached. A simple playbook:
- Confirm the signal. Check the data window, rule out seasonality and look at the underlying pull requests.
- Assign an owner. One person accountable for the service's health, not a channel.
- Pick a response proportional to the slope. For a mild decline, add a review rule (for example, a second reviewer on agent pull requests touching core invariants). For a steep one, schedule deliberate human work: a rewrite of a critical path, pairing sessions, or a short ownership rotation.
- Set a review cadence. Revisit the trend monthly until it flattens.
- Record the decision. Note what you changed and when, so the next trend reading can show whether it worked.
How do you avoid alert fatigue?
Trend detection can produce more noise than thresholds if you are careless. A few rules keep it useful:
- Alert on sustained slopes in critical services only; everything else goes into a weekly or monthly digest.
- Group related signals into one finding per service instead of six separate alerts.
- Route findings to the service owner, not to a shared channel nobody owns.
- Snooze with a reason and a date, so dismissals are visible and revisited.
- Track how many findings led to action. If the answer is near zero, tune the rules or stop sending them.
A checklist to start this quarter
- Pick your five most critical services.
- Compute human-touched share, review depth per changed line and recent contributor count for each, monthly, for the last six months.
- Fit a trend and note the monthly slope for each signal.
- Overlay reverts, incidents and rework for the same services.
- Project the worst two forward with a range, and mark known seasonal events.
- Assign an owner and a first response to anything trending toward critical within two quarters.
Where Sparkey fits
Sparkey computes these signals for you from the work your teams already do. Lens links coding-agent sessions to the pull requests and commits they produced, so human-touched share is measured, not estimated. Quality signals (duplication, churn, rework, reverts, change-failure) are computed across all pull requests. Drift detection then shows trends and projections per service and team, with ranges, so you see the slope while there is still time to act.
Thresholds tell you when it is too late. Trends tell you while you can still act. In part 4, "What Is an AI SDLC Workflow? A Framework That Compounds", we look at how to turn those actions into a repeatable workflow, with each step owned by a person, an agent or a tool.
Frequently asked questions
What is the difference between a drift alert and a threshold alert?
A threshold alert fires when a metric crosses a fixed line, such as change-failure rate above 15%. A drift alert fires when a metric has moved steadily in one direction for several periods, regardless of its current level. Drift alerts give earlier warning; thresholds confirm a breach.
Is a falling human-touched share always a problem?
No. Some code is fine to generate with little human editing, such as scaffolding or migrations. It becomes a problem when the decline happens in a critical service and coincides with rising reverts, incidents or rework in the same areas.
How much data do I need before projecting a trend?
As a rule of thumb, at least three months of history and enough merged changes per period for the number to be stable. Fewer than that and a single large pull request or a holiday week can produce a misleading slope.
How do I measure review depth for agent-generated pull requests?
Normalize by size: review time and substantive comments per changed line, rather than per pull request. Agent diffs tend to be larger, so a constant review time per pull request usually hides shallower review.
Who should own a drift finding?
A single named person accountable for the affected service, typically its tech lead or engineering manager. Sending findings to a shared channel without an owner is the fastest route to alert fatigue.
See your own AI SDLC, measured
Sparkey shows how AI coding tools and agents are changing your teams, your code and your costs.


