
How to Measure AI's Impact on Engineering: Start With a Baseline
Measure AI's impact on engineering by recording a baseline: human-touched share of merged code, workflow per PR, intent-to-deploy time and cost per outcome.

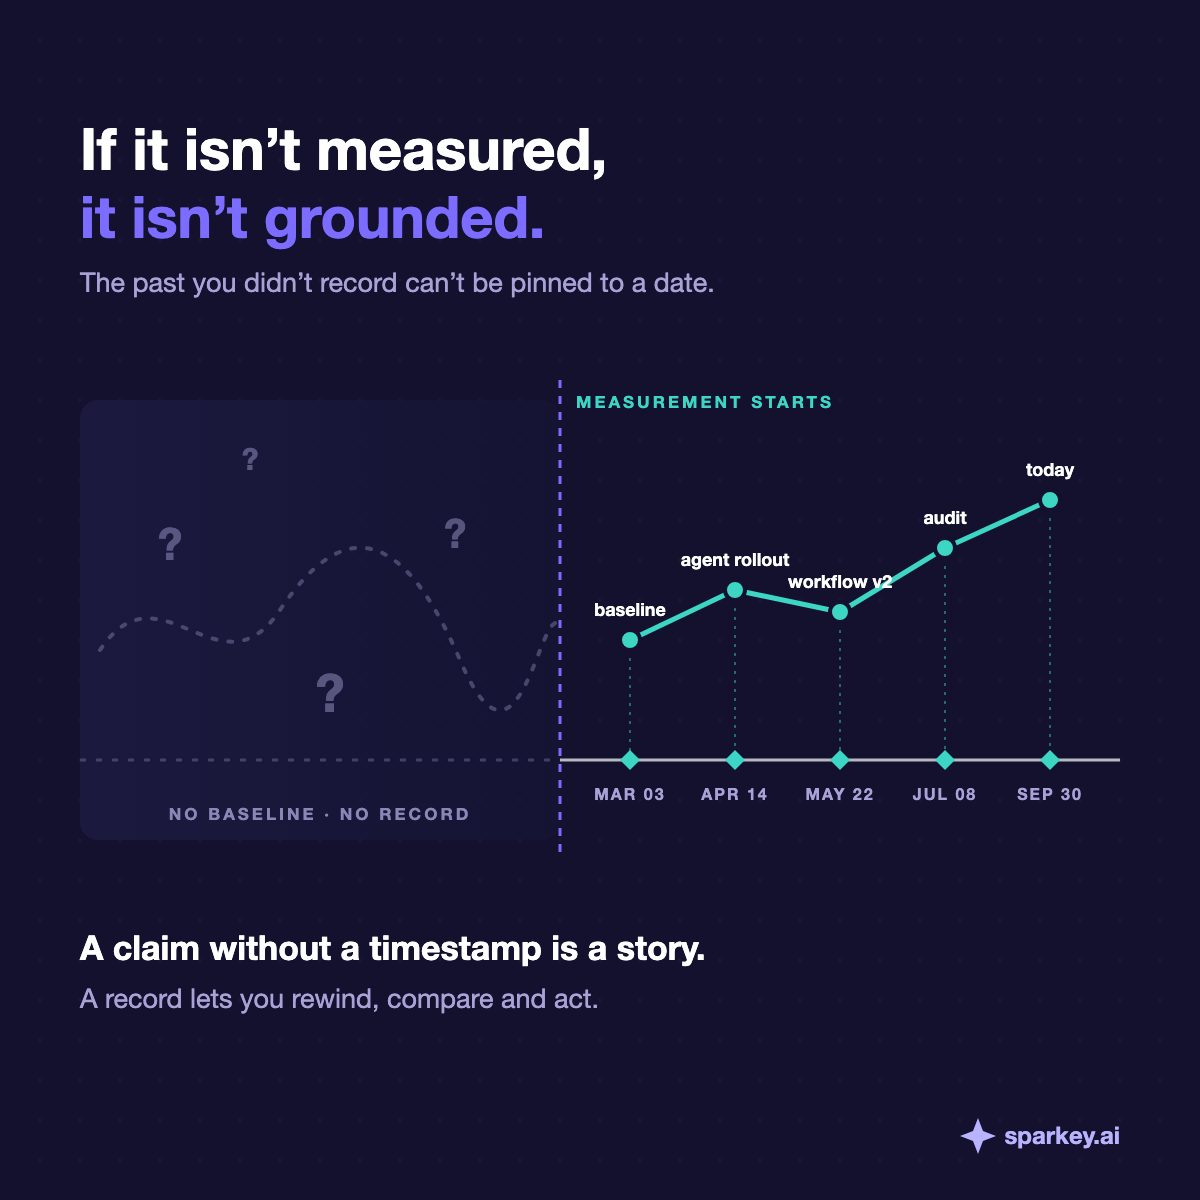
To measure the impact of AI coding tools and agents on an engineering org, you need a dated record of how the system worked before the change and a continuous record of how it works now, per repository and team. The core measures are how much of the merged code a human actually wrote, edited or directed, which workflow produced each PR, how long work takes from intent to deploy, and what each useful outcome costs. Without that baseline, any claim of improvement is a feeling, not a finding.
This is part 1 of a 5-part series on the AI SDLC: how software delivery changes when agents do a growing share of the work, and what engineering leaders need to keep it grounded. We start with measurement because every later part (preserving speed, keeping quality, governing workflows) depends on having a record to compare against.
Why "we're 30% faster" claims don't hold up
Every engineering org I talk to has an AI story. "We're 30% faster." "Review time dropped." "Agents write half our code now." Ask one follow-up question: compared to when?
Usually there's no answer. The rollout happened, the tools changed three times, a reorg moved two teams, and nobody captured what the system looked like before. The claim floats. It can't be pinned to a date, a team or a repository, so it can't be defended in a budget review and it can't be used to decide anything.
Floating claims also hide the uncomfortable cases. An org-wide "faster" can be true while one critical service is quietly accumulating code nobody on the team fully understands. If you only have the headline, you never see the service.
What evidence disappears when you don't measure AI-assisted development?
The hard part about measuring an AI SDLC is not computing metrics. It is that the raw evidence is unusually perishable. Three things vanish by default:
- Agent sessions. A coding agent's session lives in a terminal or an editor panel. When it closes, the sequence of prompts, tool calls, retries and token spend is gone unless something captured it.
- Prompts and intent. The instruction that produced a change is rarely stored. The PR description is written afterwards, often by the agent itself, and describes the result rather than the request.
- Authorship in the diff. A PR shows what changed, not who or what wrote each line. A human-authored commit may contain 400 generated lines and 12 edited ones. Version control has no field for that.
Six months later you cannot reconstruct any of this. You can only guess, and guesses tend to agree with whoever is presenting them.
What should you measure? The four records that matter
You do not need fifty metrics. You need a small number of records that are hard to game and that answer the questions leadership actually asks.
1. Human-touched share of merged code, per repo, per month
For each merged change, estimate how much a human wrote, meaningfully edited or directly steered, versus what an agent generated and a human accepted as is. Aggregate per repository and per month. This is the single most useful number for understanding ownership: it tells you where the team still knows the code and where it is drifting toward code it merely approved.
For example, a ledger service that was 61% human-touched in March and 31% today is not automatically a problem. It is a fact a leader can act on: maybe review depth on ledger needs to rise, maybe the team needs time to read what was merged, maybe it's fine because the generated code is mostly tests. Without the March number, there is nothing to discuss.
2. Which workflow produced which PR
Record whether a PR came from a person working alone, a person pairing with an assistant, an agent run started from an issue, or a multi-step agent workflow. Link the PR back to the agent sessions that produced it. When a checkout change adding multi-currency support causes an incident, the first question is "how was this built?", and you want an answer rather than an archaeology project.
3. Time from intent to deploy, broken into stages
Measure from the moment work was intended (issue created or picked up) through first commit, PR opened, review, merge and deploy. AI usually compresses the build stage and often expands review and validation. A single cycle-time number hides that shift; a stage breakdown shows where the time went.
4. Cost per outcome
Token spend per developer is a budget line, not a measure. Attribute agent cost to the PRs and work items it produced, then to outcomes: merged and still in place after 30 days, not reverted, not reworked. A cheap session that produced a reverted PR was expensive.
Alongside these four, track quality signals across all PRs, AI-assisted or not: churn, rework, reverts and change-failure rate. Measuring only AI-tagged work lets problems hide in whatever goes untagged.
How do you start measuring if the rollout already happened?
The best time to start was before your first agent rollout. The second best time is this sprint. Most orgs are mid-rollout, and that is workable, because a surprising amount of the past is still recoverable.
- Reconstruct what history still holds. Git, PR and CI history go back years. From them you can rebuild cycle time by stage, review depth, churn, reverts and change-failure rate per repository and month, including the months before AI tools arrived.
- Mark the rollout dates. Write down when each team got which tools, when agents were allowed to open PRs, and when policies changed. These dates turn trend lines into before-and-after comparisons.
- Estimate past authorship where you can. Commit trailers, bot accounts, PR labels and diff patterns give a partial, lower-confidence picture. Label it as estimated and keep it separate from measured data.
- Capture sessions from now on. Add lightweight capture to the places agents run (developer machines and CI) so sessions, prompts, tool calls and tokens are recorded and linked to the commits and PRs they produced.
- Tag workflows at the PR. Use a label, template field or automated classification so every new PR records which workflow produced it.
- Publish a first monthly snapshot. Per repository and team: human-touched share, workflow mix, stage times, cost per outcome, quality signals. Freeze it with a date. That snapshot is your baseline from here on.
Within a month you will have a real baseline for everything going forward and a reasonable, clearly labeled reconstruction for the period before.
Common pitfalls when measuring AI coding tools
Vanity metrics
Lines generated, suggestions accepted and acceptance rate measure tool activity, not engineering outcomes. A high acceptance rate can mean the tool is good or that reviewers stopped reading. Neither number tells you whether the merged code was kept, reverted or rewritten a week later.
Surveillance perception
If engineers believe the data ranks them, the data will degrade: people will route work around capture or stop using tools openly. Measure the system, aggregate at team and repository level, be explicit about what is collected and why, and never use authorship share as an individual performance score. A low human-touched share is a property of a codebase, not a verdict on a person.
Averaging away the hotspots
An org-wide average of 55% human-touched can hide one payments repository at 20% and falling. Risk concentrates in specific services, so report per repository and highlight the steepest trends rather than the mean.
Changing definitions mid-stream
If what counts as "human-touched" or "deployed" changes, earlier numbers stop being comparable. Version your definitions and note the date of any change on every chart.
How do you present AI impact to leadership?
Leaders do not need a dashboard tour. They need a few dated sentences they can act on, each tied to a repository or team:
In March, ledger was 61% human-touched. Today it is 31%, review time per PR is flat, and rework is up. We are adding a second reviewer for ledger and scheduling a code walkthrough.
- Lead with trends, not snapshots. Direction and slope matter more than a single month's value.
- Pair every speed number with a quality number. Faster with rising reverts is not a win.
- Show cost per outcome next to spend. It reframes AI budget from "how much" to "how much per kept change".
- State confidence. Separate measured data from reconstructed estimates, and say which is which.
- End with decisions. Each finding should come with an action, an owner and the date you will look again.
Checklist: your measurement baseline this sprint
- Rollout dates written down per team and tool
- Stage-level cycle time reconstructed from git, PR and CI history
- Churn, rework, reverts and change-failure rate computed for all PRs
- Session capture running where agents run, linked to commits and PRs
- Workflow recorded on every new PR
- Human-touched share computed per repository per month, with estimated history labeled
- Agent cost attributed to PRs and outcomes
- Definitions versioned and published to the engineering org
- First dated snapshot frozen and shared
Where Sparkey fits
We built Sparkey to make this record automatic. Lens, a lightweight CLI and hook, captures agent sessions (prompts, tool calls, tokens and cost) and links them to the commits and PRs they produced. Sparkey computes the human-touched share per repository, team and month, tracks quality signals across all PRs, and attributes cost to outcomes. It also backfills what git, PR and CI history can still tell you, so the baseline reaches back before capture started.
Measurement gives you the record. The next question is what that record shows after the first burst of speed fades. Part 2 of this series picks that up: "AI makes it easy to go fast. Staying fast is the hard part."
Frequently asked questions
What is a human-touched share of merged code?
It is the proportion of merged code that a human wrote, meaningfully edited or directly steered, as opposed to code an agent generated and a human accepted unchanged. It is tracked per repository and month to show where a team still owns its code and where ownership is thinning.
Can I measure AI impact without a pre-rollout baseline?
Yes, partially. Git, PR and CI history let you reconstruct cycle time, churn, reverts and change-failure rate for the months before the rollout. Authorship and agent sessions can only be estimated for the past, so label them as estimates and capture them properly from now on.
Is acceptance rate a good measure of AI coding tool value?
No. Acceptance rate measures how often suggestions were taken, not whether the resulting code survived review, stayed in place or caused rework. Measure outcomes such as kept changes, reverts and cost per outcome instead.
How do I avoid AI measurement feeling like surveillance?
Aggregate at team and repository level, publish what is collected and why, and never use authorship share to rank individuals. Present the data as a description of how the system works, used to decide where to add review, training or tooling.
How often should I review AI SDLC metrics?
Monthly per repository and team is a good default, with a quarterly summary for leadership. The point is to watch trends and slopes, so consistency of cadence and definitions matters more than frequency.
What does cost per outcome mean for coding agents?
It is agent spend (mostly tokens) attributed to the PRs it produced and divided by the outcomes that held up, such as changes still merged after 30 days without revert or heavy rework. It shows which workflows are worth their cost, not just how much was spent.
See your own AI SDLC, measured
Sparkey shows how AI coding tools and agents are changing your teams, your code and your costs.


